🤿 Deep Dive: Comcast Corporation

La empresa de "mil" tentáculos.

🤯 ¿Qué tienen en común la NBA, los parques temáticos de Orlando y 23 millones de puntos de WiFi?

🐙 Conoce en 7 minutos la historia de una de las empresas con mayor diversificación en la industria TMT.

🎉 Una cordial bienvenida a nuestros nuevos lectores y lectoras: ¡los estábamos esperando! Muchas gracias a todos por seguir recomendando earningsHub.
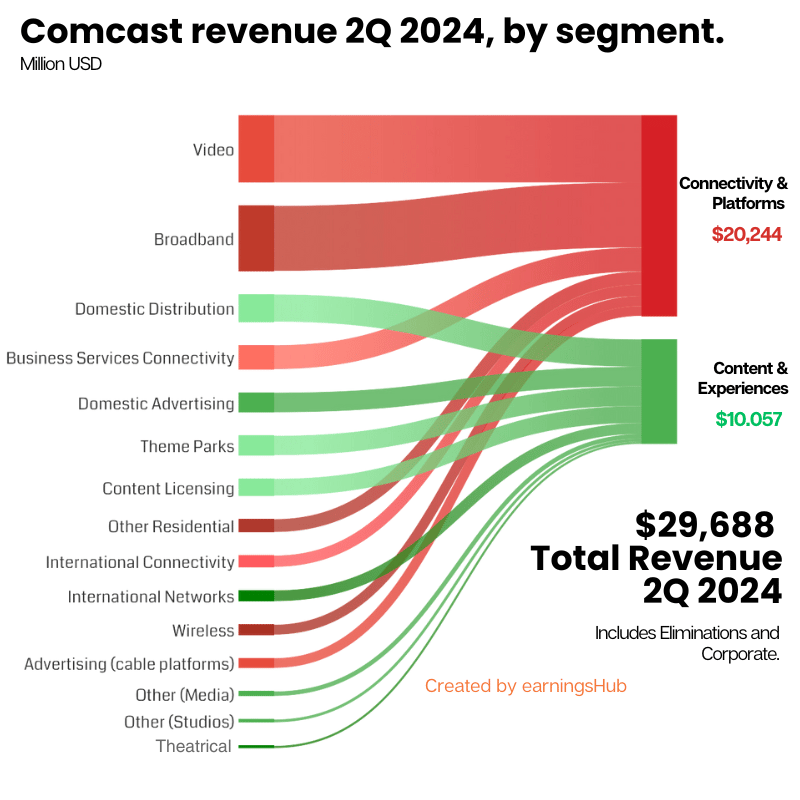
A Sankey diagram illustrating Comcast's revenue distribution for Q2 2024, broken down by segment. The diagram is divided into two major categories: "Connectivity & Platforms," which generated $20,244 million, and "Content & Experiences," which contributed $10,057 million to the total revenue of $29,688 million. The "Connectivity & Platforms" segment includes revenue streams from Video, Broadband, Domestic Distribution, Business Services Connectivity, Domestic Advertising, and Other Residential services, shown in various shades of red. The "Content & Experiences" segment includes revenue from Theme Parks, Content Licensing, International Connectivity, International Networks, Wireless, Advertising (cable platforms), Other (Media), Other (Studios), and Theatrical services, represented in shades of green. The diagram highlights the proportional contribution of each revenue stream to the overall total, with connectivity services dominating the revenue mix. The graphic is titled "Comcast revenue 2Q 2024, by segment" and indicates that the total revenue includes eliminations and corporate adjustments. A small text note at the bottom right reads "Created by earningsHub."

Diagrama de Sankey con la distribución de ingresos de Comcast al 2Q 2024. Creado por earningsHub con información de la empresa.

Suscríbete para continuar.

earningsHub es leído por las mentes más estratégicas del sector. Ingresa con 1-click.

Already a subscriber?Sign In.Not now